The Cash Flow Blueprint to Financial Freedom
Income investing, explained like you're 10. Doodles included.
Cash flow investing means owning investments that pay you cash on a schedule, instead of only hoping their price goes up. Usually that means funds that pay out every month. While you build, each payment buys more shares, so the next payment is bigger. The goal: one day the monthly payments cover your bills, and you live on them without selling a single share. Here is the whole idea, explained simply.
The old way
Here's how most of us were taught to invest.
- You open an investing account(like the one at your bank)
- You buy ________(a fund? a stock? whatever your coworker said?)
- You hope it goes up 🤞
- You wait until you're 65(and try not to peek)
- Then you sell pieces of it to live on
Your money pays you when you sell it.
And look, it works. Plenty of people retire this way.
But see the catch? For 30 or 40 years the money can't pay you anything. It's a number on a screen going up and down. The only way to finally use it is to start selling it off.
We didn't want to wait until 65 to feel it.
The cash flow way
Same account. Same app on your phone. Different kind of fund.
Instead of only owning stuff that might grow, you own funds that pay you cash. Every month. Some pay twice a month.
- Same investing account
- Own funds that pay cash(on a schedule, like a paycheck)
- 💵 Paydaycash lands in your account
- Building? The cash buys more sharesmore shares = a bigger next payday↻ repeat every payday
- One day, payday covers your bills
- Live on it. Keep every share.
Your money pays you while you keep it.
Most people build a pile. We're building a paycheck.
That's the whole game. The rest of this page is how the machine works, so nothing catches you off guard.
Where does the cash come from?
Some of it is plain old dividends from the companies inside the fund. But in the high-paying funds we focus on, the big engine is something called a covered call.
First, the best part: it’s 100% automatic.
We don’t do a thing. We just own the ETF, and the expert fund managers do 100% of the heavy lifting, every single month: the deals, the borrowing, the balancing. Brilliant. Still, it helps to know what’s happening under the hood, so here it is with a trading card:
You own a card worth $100
Someone pays you $1 today for a deal: they can buy your card for $105 anytime this month
It stays under $105
You keep the card and the $1 🎉
It jumps to $130
You sell it for $105 and keep the $1. You miss the rest 😅
You traded part of the “maybe” for cash today.
A covered call fund does exactly this, just bigger. It owns hundreds of stocks and sells these little deals on them every month. All those $1s get bundled together and paid out to you.
The catch: sell these deals on everything you own and you only ever ride part of the way when the market rockets.
So the best funds, often called enhanced ETFs, do two smart things at once:
Inside an enhanced ETF
- Covered calls on only part of it, often somewhere between a fifth and a half: that part makes the cash.
- The rest is left alone: that part is free to grow.
- A little leverage, about a quarter extra: more of the same stocks, to win back growth.
The idea: the paycheck now, and the growth.
Covered calls on part of it + a little leverage. That combo is the key.
It’s exactly the combo we look for. Borrowing is a power tool, so it cuts both ways: good years get better and bad years get worse. In the funds we hold, it’s kept modest: about a quarter extra.
And the best managers are seriously good at this. Some of these funds have paid out a lot, every single month, and still grown over the years. Not all of them do, and the next two parts show you how to tell.
Why does the price drop on payday?
This one freaks a lot of new people out, so let’s clear it right now.
On payday, the fund’s price drops by about the amount it pays you.
Before payday
The fund$10.00
Your pocket$0.00
After payday
The fund$9.90
Your pocket$0.10
Still $10.00 total. Nothing lost. It just moved.
You didn’t lose 10 cents. It moved from the fund’s pocket into yours. Left pocket, right pocket. Same pants.
That’s also why a high-paying fund’s price chart dips after every payday. The chart only shows the fund’s pocket. Yours isn’t on it.
Here’s the part that gets us excited: with a good fund, time refills the fund’s pocket.
The companies inside keep growing, so the price can climb back after payday, even if you never reinvest a cent. HDIV, one of the funds we hold, is a beautiful example:
HDIV, month by month
The line is its price. Every lime tick underneath is a month it paid out.
- $16.81 August 2021, its first full month
- $14.20 the 2022 slump
- $23.25 September 2026
Along the way it paid out $9.50 per unit in cash, every single month, and the monthly payout itself rose from 11.8¢ to 19.5¢.
Monthly closing prices and payouts on the TSX, August 2021 to September 29, 2026. One of the funds we hold. History, not a promise, and not a recommendation.
Not every fund does this. A price can also keep sliding because the fund pays out more than it earns. Which is exactly why you need the next part.
The crash test: why we went all in
Here’s the moment that made a lot of income investors ditch everything else and go all in on these funds.
In the 2020 crash, the market fell about a third in a few weeks. Every kind of payout got tested at once:
The 2020 crash test
- Dividend stocks: many cut or paused their payouts
- REITs: many cut their payouts
- Riskier high-yield stocks: many cut, some stopped paying at all
- Covered call ETFs: many kept paying, month after month
The paycheck kept landing.
Why? Their cash doesn’t come from company profits. It comes from selling those little deals, and when markets get scary, people pay more for those deals. So the engine kept running right through it.
That’s what made going all in easy.
No promises for the next crash, of course. Every crash is different. But once you’ve watched a paycheck make it through one, you stop fearing the next.
Market crashes are actually exciting now
Wait, what? How?
A follower asked me this in my DMs:
Based on ur experience when market say crashes or performs bad, what’s recovery time been like to gain back big losses with these types of ETFs?
Here’s my answer, doodled:
| Before the dip | In the dip | |
|---|---|---|
| Price per share | $10 | $8 |
| Shares you own | 1,000 | 1,000 |
| What your app shows | $10,000 | $8,000 |
| Your payday, at 10¢ a share | $100 | $100 |
Put in another $1,000:
Before the dip100 more shares
In the dip125 more shares
Same money, 25 more shares, and a bigger payday for as long as the payout holds.
We get paid per share, not per dollar on the screen. A dip doesn’t take a single share away, so the payday keeps landing while the red number does its thing. We’re never selling, so we don’t need the price to recover on any schedule.
Meanwhile, every dollar we add buys more shares on sale. More shares, more income. That’s why a dip gets us excited, not anxious. Markets always cycle through highs and lows; we just want money coming in no matter what, and the choice to spend it or reinvest it.
And the recovery question? Scroll back up to the HDIV chart: after its 2022 slump it took until July 2024 to close above where it started, and it paid out every single month the whole time. We got paid while we waited.
The real score: total return
If the price chart only shows half the story, what shows the whole thing?
Price change+every payout=total return
Total return is the real scoreboard. Sometimes it's great. Sometimes it's bad. A fund can pay you a lot and still lose you money overall, and total return is the number that tells you.
- “Hmmm… why is my pot still growing?” 🤔
- Total returnthe price change plus every payout
- + DRIPevery payout buys more shares, by itself↻ every payday
- More shares → a bigger payday → a bigger pot
That’s total return + DRIP.
DRIP is short for dividend reinvestment plan. Most brokerages let you switch it on, and then every payout automatically buys more shares of the fund that paid it. No clicks. No thinking.
Heads up: most brokerage apps show a fund's price and a red or green number. That number usually ignores the cash the fund already paid you. So a fund can sit in the red for months while it has paid you every single month.
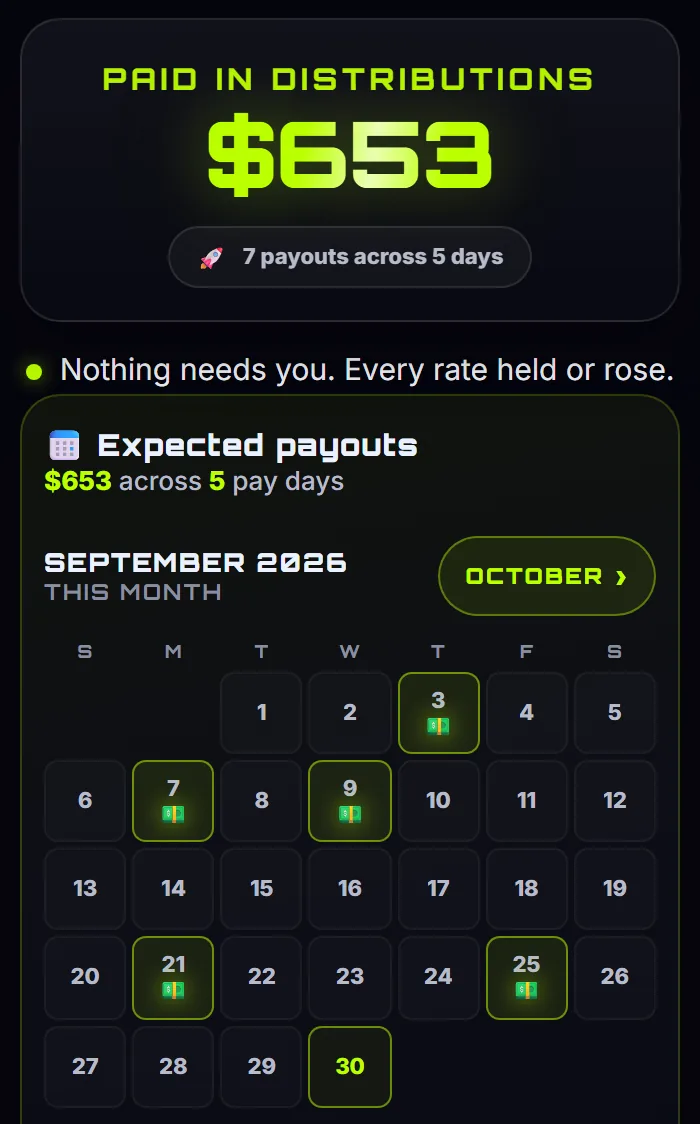
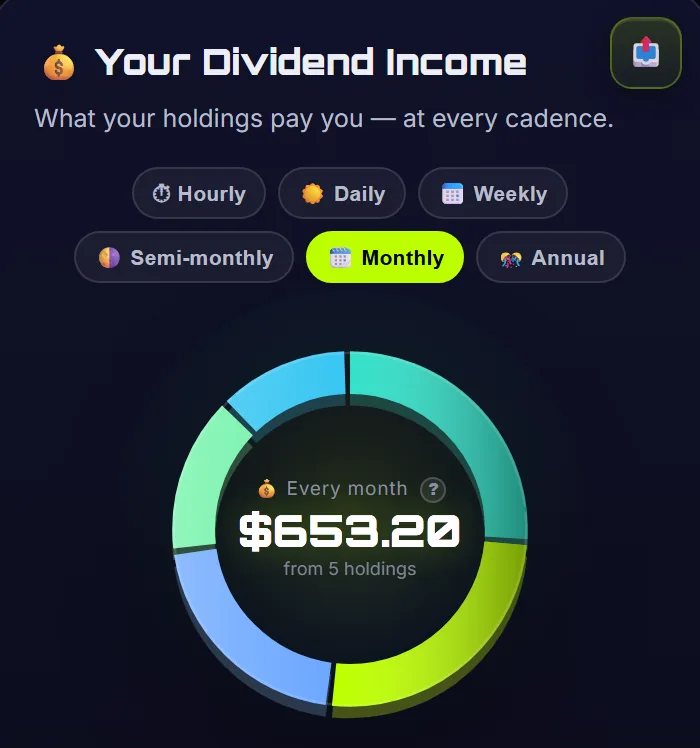
That gap is why we track ours in IncomeRPG. I built it to show what landed, what's coming next, and what the whole portfolio pays each month.
Yield is a speedometer, not a promise
Yield is how much a fund paid over a year, as a percent of its price. A 12% yield is roughly 1% a month.
It is not a locked-in rate like a savings account. It moves every day with the price, and a fund can raise, lower or cut its payment at any time.
Yield is how fast you're going. Total return is whether you're getting anywhere.
The rules we follow
Everyone's situation is different. These are ours. Not advice, just what keeps us sane.
Know what's inside
A fund is a basket. We know what's in the basket (which companies, which countries) and how it makes its cash (covered calls, borrowed money, or both).
Judge by total return
Price plus payouts. Never the price chart alone, and never the red number in a brokerage app alone.
Don't go crazy
The riskiest stuff stays small. No betting the farm on one stock. Easy on borrowed money.
Never sell (we don't have to)
The funds pay us, so we never have to sell shares to get paid. That makes it way easier to sit still when the market panics.
Think in decades
Headlines are built to scare you into clicking. We don't check prices every day. We check the paycheck.
Reinvest while we build
Right now every payday goes straight back in. Later, it pays the bills. Even then, we'll keep reinvesting a little.
No hate
Index investors, dividend investors, growth investors. Different roads, same goal. How someone invests their own money is their call.
Enjoy it. Be generous.
The point was never a bigger number. It's time, freedom, and being the one who picks up the bill. Tip well. Live now too.
The man, the myth, the legend: Adriano goes deep on these here ↗
The whole blueprint on one page
Screenshot this part.
The Cash Flow Blueprint
- Open a regular investing account
- Learn what a fund owns and how it pays
- Own funds that pay cash on a schedule
- Reinvest every payday while you build
- Judge by total return, not the price chart
- Payday covers the bills. Live on it, keep the shares
our plan, not financial advice ✍️
- Project
- Financial freedom
- Drawn by
- Us
- Scale
- One payday at a time
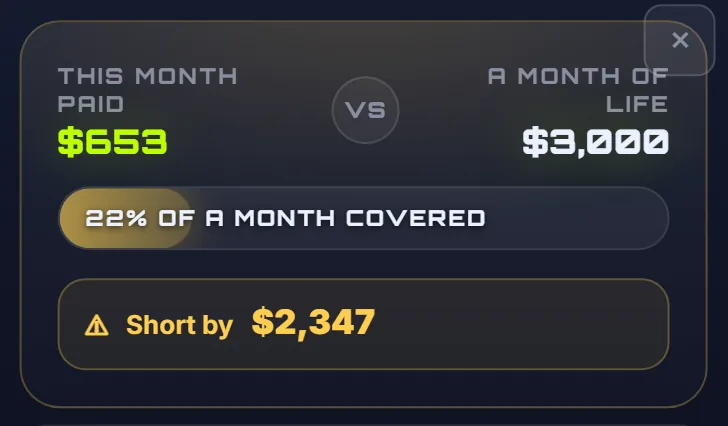
Step 6 is the finish line, and it helps to watch it move. In this sample, one month of payouts covers 22% of a month of life.
Doesn't sound like much? That's almost a week of bills, paid every month, without clocking in. Every payday nudges the bar.
Questions people also ask
Is cash flow investing the same as dividend investing?
Close cousins. Dividend investing usually means owning companies that share their profits. Cash flow investing leans on funds built to pay out more, often by selling covered calls. Both pay you cash. The engine is different.
How much money do I need to start?
Less than you think. Most brokerages let you buy a single share, and some let you buy a slice of one. Your first payday might be a few cents. That's normal. The habit is what grows first.
Are the monthly payments locked in?
No. A fund can raise, lower or cut its payment at any time, and nothing on this page is a promise. That's why the real score is total return, not the size of the payment.
Is this better than index investing?
Different, not better. Index investing usually means selling pieces later to get paid, which means working out how much you can sell each year so the money lasts as long as you do. Cash flow investing gets paid along the way and gives some growth away for it. For us, never having to figure out that math is huge: no drawdown plan to build, with or without an advisor. We live on what the funds pay and keep every share. And instead of spending it all down to $0, we get to pass an income machine on to the people we love. Plenty of people mix both. The best plan is the one you’ll actually stick with.
Everything you get
- 12 tools in one place: Pay Day, Dividend Stats, Portfolio Stats, Goals, Milestones, the Retirement Calculator, Test Contributions, the Budget Tracker, the Holdings Lab, F.I.R.E. Contributions, Fund Compare and the ETF Explorer.
- See every payday coming: what each fund is expected to pay, and when.
- Know your real number: what your portfolio pays you by the hour, day, month and year, straight from your brokerage.
- Watch the finish line get closer: how much of your monthly bills your payday already covers.
- A game that makes the slow part fun: your funds become creatures that evolve as your real money grows, with a hero, a Home Base, friends and a whole kingdom. It never changes a single number.
- Safe by design: the connection is read-only. It can’t trade, and it can’t move a cent.
Connects to the brokerage you already use




















- + more
Connections run through SnapTrade, read-only; the list is theirs and can change. Logos belong to their owners, and no endorsement is implied.
Four of the tools are free to use: the ETF Explorer, Fund Compare, and a try of Test Contributions and the Retirement Calculator.
IncomeRPG is a portfolio tracker, not an advisor. Nothing here is investment, tax or financial advice, and nothing here is a recommendation to buy or sell any security. The brokerage connection is read-only. The app cannot place a trade or move money.